Spotting a trend
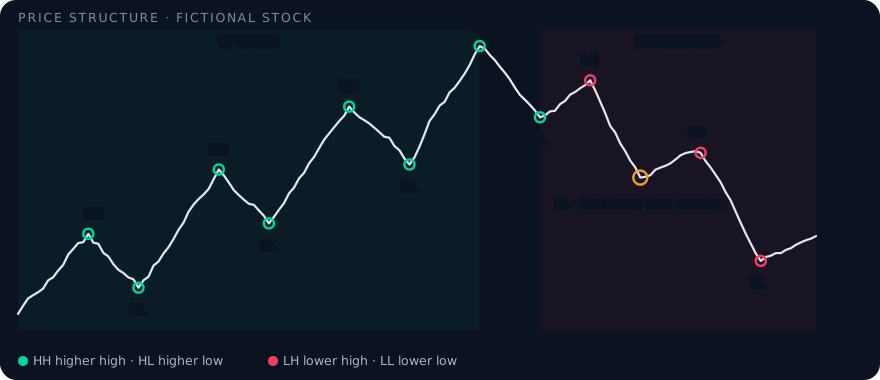
An uptrend is a series of higher highs and higher lows, a downtrend a series of lower highs and lower lows. In between is the sideways phase, where highs and lows do not shift clearly.
How to read a trend
- Uptrend: each pullback stops above the previous low, each rally makes a new high.
- Downtrend: each bounce fails below the previous high, each decline makes a new low.
- Sideways: highs and lows stay in a range. Trend signals such as MACD crossovers are unreliable here.
A trend ends when the pattern breaks: in an uptrend, the first low below the previous low is an early warning.
Combining trend tools
Highs and lows show the structure, the EMAs smooth it, and the ADX measures how strong it is. A stock with higher highs, price above a rising EMA20 and ADX above 25 is in a clear uptrend. If ADX is below 20, treat the same chart as a range.
Frequently asked questions
How do you know if a stock is in an uptrend?
Look for higher highs and higher lows, price above rising moving averages and, for confirmation, an ADX above about 25.
What timeframe should I use?
It depends on the holding period. For swing trades over weeks, daily charts with EMA 20, 50 and 200 are common; for very short trades, intraday charts.
See it in the screener
The live demo shows every term with example data, right next to the score and its reasons.