Support & resistance
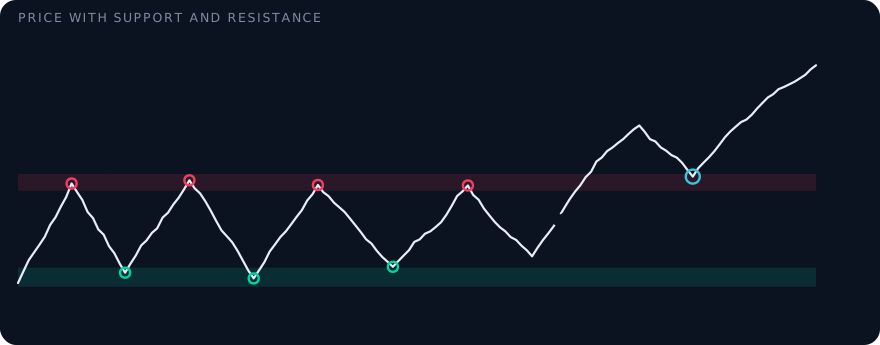
Support is a price area where buyers were recently strong enough to stop a decline. Resistance is an area where sellers stopped a rise. The more often a level holds, the more market participants watch it.
How to find support and resistance
- Recent highs and lows: the simplest version, for example the 50-day high and low.
- Levels touched several times: the more reactions, the more relevant the level.
- Round numbers: prices like $100 attract orders.
- Moving averages: a rising EMA50 often acts as support in an uptrend.
Treat levels as zones, not exact lines. A stock can dip a little below support intraday and still close above it.
How traders use them
Support below the entry is a natural place for the stop, resistance above it a first target. When a level breaks with strong volume, it often switches roles, see breakout and pullback.
Frequently asked questions
How strong is a support level?
It gets stronger the more often it held, the higher the volume at that level and the more visible it is, for example a round number or a multi-month low.
What happens when support breaks?
Often the selling accelerates, and the old support later acts as resistance when price returns to it.
See it in the screener
The live demo shows every term with example data, right next to the score and its reasons.