EMA (20 / 50 / 200)
A moving average that weights recent prices more heavily. Price above the EMA20 and the EMA20 above the EMA50 means the short-term trend is up (EMA stack), the reverse means down. The EMA200 shows the long-term picture.
How an EMA is calculated
α = 2 ÷ (n + 1) · EMA today = close × α + EMA yesterday × (1 − α)
Example: for the EMA20, α = 2 ÷ 21 ≈ 0.095. Yesterday's EMA20 was $100.00, today's close is $105.00. EMA20 = 105 × 0.095 + 100 × 0.905 ≈ $100.48. A simple average would react more slowly, because it weights the oldest day as much as today.
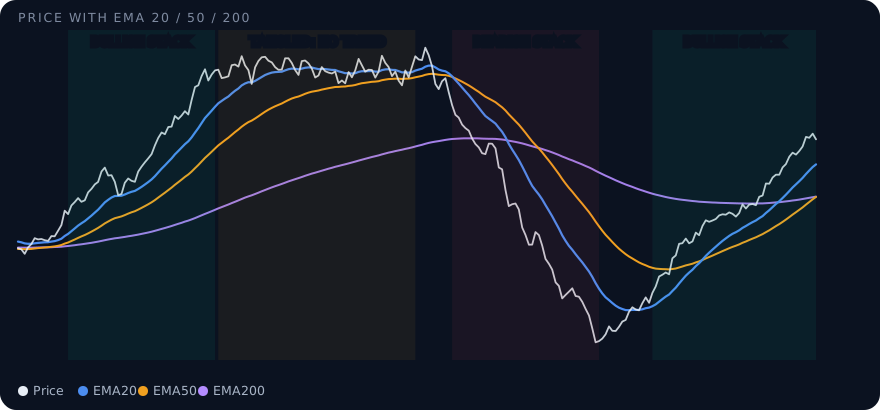
The EMA stack
- Bullish stack: price above EMA20, EMA20 above EMA50. The short-term trend points up.
- Bearish stack: price below EMA20, EMA20 below EMA50. The short-term trend points down.
- Tangled EMAs: lines crossing each other and running flat. No clear trend, often together with a low ADX.
- EMA200: the long-term filter. Calls below it and puts above it trade against the big picture.
Common mistakes
- Trading every touch of an EMA. In sideways phases price crosses the EMAs constantly.
- Ignoring the slope. A rising EMA20 supports an uptrend; a flat one says little.
- Looking at one EMA only. The order of several EMAs tells you more than a single line.
Frequently asked questions
What is the difference between EMA and SMA?
Both are averages of past closes. The EMA weights recent prices more and reacts faster to new moves; the SMA weights all days in the period equally.
How does the screener use the EMAs?
The EMA stack is the basis of every trend signal. In the swing horizon, a call below the EMA200 or a put above it costs one point.
See it in the screener
The live demo shows every term with example data, right next to the score and its reasons.