MACD (12 / 26 / 9)
The difference between two EMAs (12 and 26 days) and its signal line (9 days). MACD above the signal line means the upward move is gaining momentum. The histogram shows whether that momentum is growing or fading.
The three parts of MACD
MACD line = EMA12 − EMA26 · Signal line = EMA9 of the MACD line · Histogram = MACD − signal
Example: a fictional stock has an EMA12 of $104.00 and an EMA26 of $102.50. The MACD line is +1.50: the short-term average is above the long-term one, momentum is up. The signal line is at 1.20, so the histogram is +0.30. If the histogram grows over the next days, momentum is accelerating; if it shrinks, the move is slowing down.
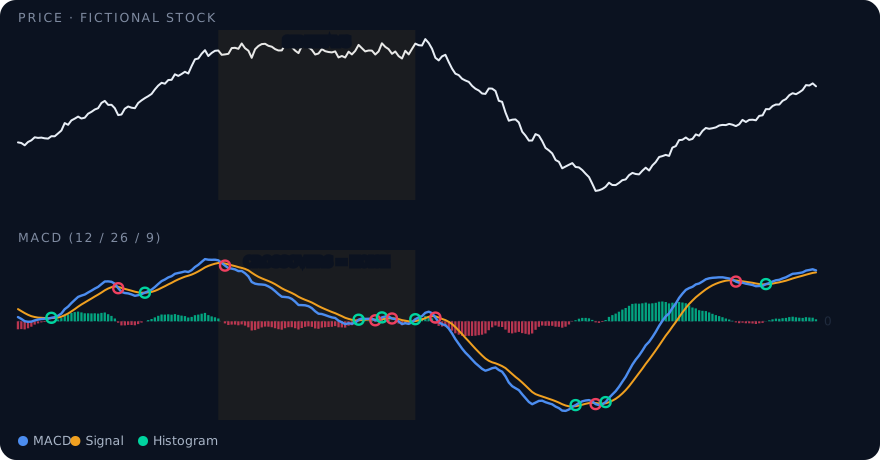
Crossovers and the histogram
- Bullish crossover: the MACD line crosses above the signal line, the histogram turns positive.
- Bearish crossover: the MACD line crosses below the signal line, the histogram turns negative.
- Zero line: MACD above zero means EMA12 is above EMA26, a sign of an uptrend.
- Histogram direction: often more useful than the crossover itself, because it shows whether momentum is still building.
When MACD fails
MACD follows price with a delay, because it is built from averages. In a sideways market the lines cross back and forth, and each crossover is a false signal. That is why trend strength matters: with an ADX below 20 crossovers are mostly noise. Also check EMA direction; if MACD and EMAs disagree, the picture is unclear.
Frequently asked questions
Is a MACD crossover a buy signal?
On its own, no. It shows a change in momentum. In a clear trend with enough trend strength it confirms the direction; in a sideways market it often reverses within days.
How does the screener use MACD?
It confirms the trend direction. A histogram rising three days in a row earns a bonus, MACD against the signal direction costs a point, and if MACD and EMAs disagree, the screener waits or deducts.
See it in the screener
The live demo shows every term with example data, right next to the score and its reasons.