RSI (14)
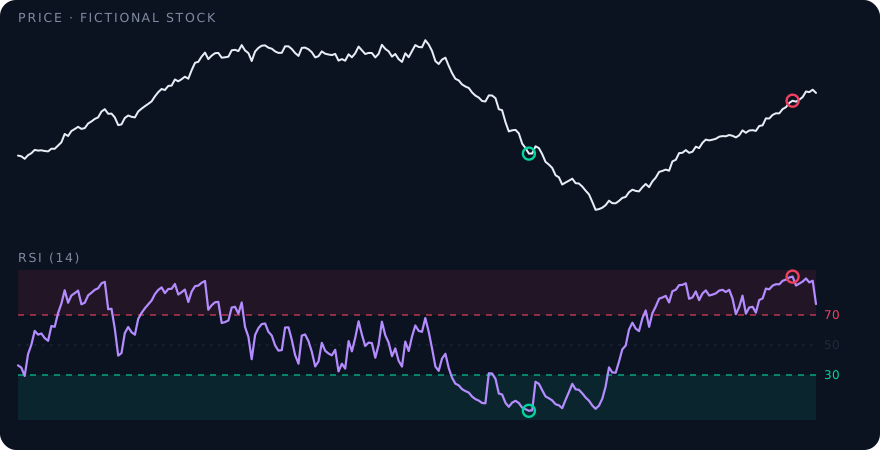
Compares the strength of up days and down days on a scale of 0 to 100. Classically, above 70 is overbought and below 30 oversold. In strong trends, though, RSI can stay at an extreme for a long time.
How RSI is calculated
RS = average gain ÷ average loss (14 days) · RSI = 100 − 100 ÷ (1 + RS)
Example: over the last 14 days a fictional stock gained $1.20 on average on up days and lost $0.80 on down days. RS = 1.20 ÷ 0.80 = 1.5. RSI = 100 − 100 ÷ 2.5 = 60. Buyers were stronger, but the stock is far from stretched.
How to read RSI in practice
- 40 to 60: neutral, no extreme in either direction.
- Above 70: overbought. The rise was fast; a pause or pullback becomes more likely.
- Below 30: oversold. The drop was fast; a bounce becomes more likely, but is not guaranteed.
- In a strong trend RSI can stay above 70 or below 30 for weeks. Check trend strength with ADX before trading against it.
A divergence, when price makes a new high but RSI does not, is often an earlier warning than the level itself.
Common mistakes
- Buying calls just because RSI is below 30. Oversold can get more oversold, especially in a downtrend with bad news.
- Selling a strong trend just because RSI is above 70. Strong stocks often stay overbought.
- Using RSI alone. It measures speed, not direction or trend strength. Combine it with EMAs, MACD and ADX.
Frequently asked questions
What is a good RSI to buy calls?
There is no single level. A call in an uptrend with RSI between about 45 and 70 has room to run; buying into RSI above 70 means paying for a move that may already be stretched. The screener deducts points when you buy a call into an overbought market.
Why does the screener use 72 and 28 instead of 70 and 30?
Slightly wider thresholds reduce false alarms in trending stocks, which often touch 70 or 30 without reversing.
See it in the screener
The live demo shows every term with example data, right next to the score and its reasons.