Bollinger Bands (20, 2σ)
A band two standard deviations around the 20-day average. A close outside the band shows the price is statistically stretched.
How the bands are built
Middle band = 20-day simple average · Upper/lower band = middle ± 2 × standard deviation (20 days)
Example: a fictional stock has a 20-day average of $100 and a standard deviation of $2.50. The bands run from $95 to $105. A close at $106 is outside the upper band: the stock has moved unusually far in a short time.
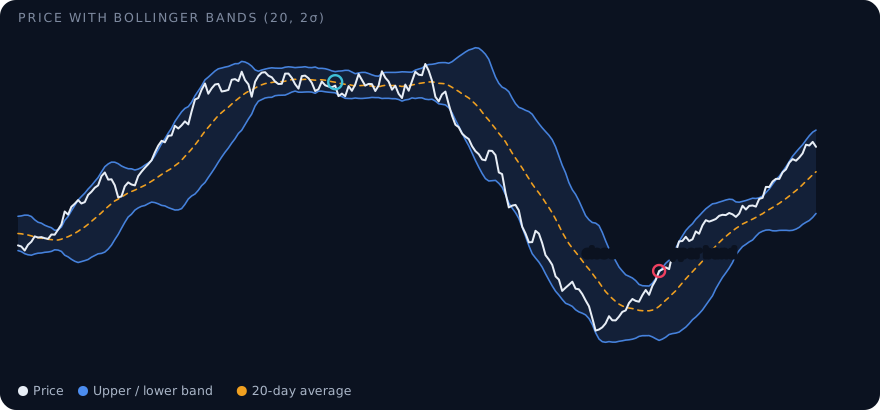
How to read them
- Close outside a band: statistically stretched. Under normal-distribution assumptions about 95 % of closes fall inside, but real markets break out more often.
- Walking the band: in strong trends price can ride along the upper or lower band for days. Outside the band is not automatically a reversal.
- Squeeze: very narrow bands show low volatility. A larger move often follows, the direction is open.
What this means for option buyers
Buying a call when price is already above the upper band means paying after a stretched move; a pullback to the middle band costs the option value and time. Stretched moves against the trend can be the setting for a counter move, but only with a tight plan. The RSI and the trend strength from ADX help to tell a stretch from a breakout.
Frequently asked questions
Is a close above the upper Bollinger Band bearish?
Not necessarily. It shows a stretched move. In a strong trend price can stay near the upper band; in a sideways market a return to the middle band is more likely.
How does the screener use Bollinger Bands?
A call above the upper band or a put below the lower band costs a point. For fade signals the stretch is a requirement.
See it in the screener
The live demo shows every term with example data, right next to the score and its reasons.