ADX (14)
Measures how strong a trend is, not which direction it goes. Below 20 a market is considered directionless; from 25 it is clearly trending.
What ADX measures, and what it does not
ADX is built from two lines: +DI measures how strongly the highs push up, −DI how strongly the lows push down. ADX smooths the gap between them over 14 days. The result answers one question: how directional is the market? It says nothing about whether the direction is up or down; for that, look at +DI against −DI or at the EMAs.
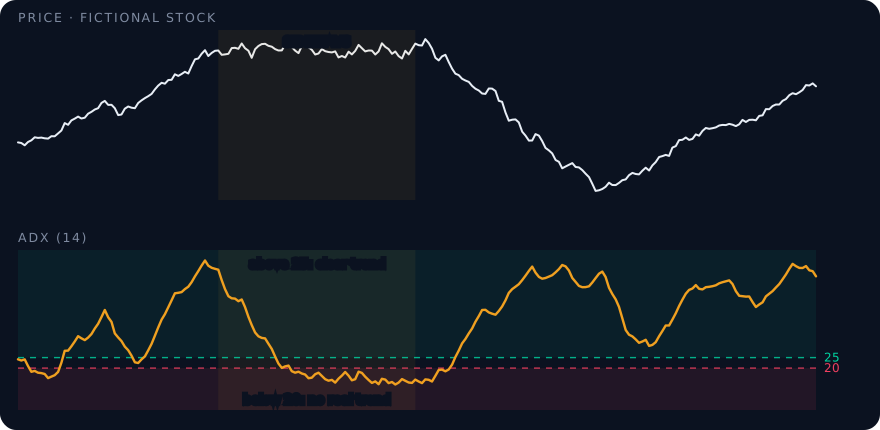
Levels to know
| ADX | Meaning | For option buyers |
|---|---|---|
| below 20 | no real trend | signals like MACD crossovers are mostly noise |
| 20 to 25 | trend forming | usable, but not yet reliable |
| 25 to 40 | clear trend | trend-following setups work best |
| above 40 | very strong trend | trading against it is risky, it can run further |
Example: two fictional stocks both show a bullish MACD crossover. One has ADX 14, the other ADX 32. For the first, the crossover is likely noise in a sideways range; for the second, it confirms an existing trend.
Common mistakes
- Reading a high ADX as bullish. A falling stock in a strong downtrend also has a high ADX.
- Ignoring ADX before trading against a trend. A RSI extreme in a market with ADX above 35 often keeps going.
Frequently asked questions
What is a good ADX value for trend trading?
Above 25 is commonly seen as a clear trend. The screener requires at least 20 for swing setups and treats 25 or more as a plus.
Why does the screener show WAIT despite a bullish signal?
Most often because ADX is too weak. Below 20 (short-term: 14) there is no directional setup, even if EMAs and MACD agree.
See it in the screener
The live demo shows every term with example data, right next to the score and its reasons.