ATR (14)
The average daily trading range of a stock in dollars. It shows what a “normal” day looks like for this stock.
How ATR is calculated
True range = largest of: high − low, |high − previous close|, |low − previous close| · ATR = average of the true range over 14 days
Example: a fictional stock closed yesterday at $104. Today's high is $103, the low $99. High minus low is $4, but the gap from yesterday's close to today's low is $5. The true range is $5, because it includes the overnight gap.
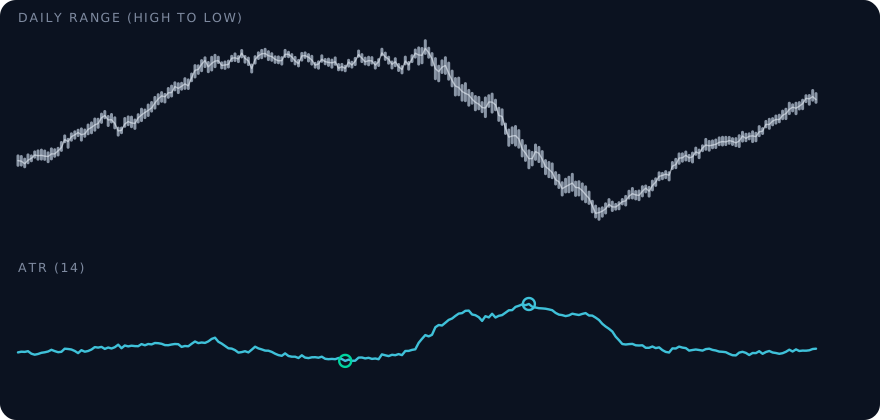
What ATR is good for
- Normal versus unusual: a $3 move is normal for a stock with ATR $4 and extreme for one with ATR $1.
- Comparing stocks: ATR as a percentage of price (ATR ÷ price) makes different stocks comparable.
- Stops in the stock price: a stop closer than about one ATR is often hit by normal daily noise.
How the screener uses it
To spot shock days. A day counts as extreme if the stock moves at least 5 % or 2.5 times its ATR in percent, whichever is larger. Example: stock at $50 with ATR $1.50, that is 3 %. 2.5 × 3 % = 7.5 %, so only a move of 7.5 % or more counts as a shock. After such a day the screener checks for reversal setups.
Frequently asked questions
Does ATR show the direction of a stock?
No. ATR only measures how far a stock typically moves per day, not which way.
What is the difference between ATR and historical volatility?
ATR is measured in dollars from daily ranges and gaps. Historical volatility is a percentage based on daily returns and is annualized, which makes it comparable with implied volatility.
See it in the screener
The live demo shows every term with example data, right next to the score and its reasons.