IV rank (IVR)
Shows where today’s IV sits between its one-year low (0) and high (100). An IVR of 20 means options on this stock are relatively cheap right now, whether 30% IV is a lot or a little in absolute terms.
How IV rank is calculated
IV rank compares today's implied volatility with its own range over the last year:
IVR = (IV today − lowest IV of the year) ÷ (highest IV − lowest IV) × 100
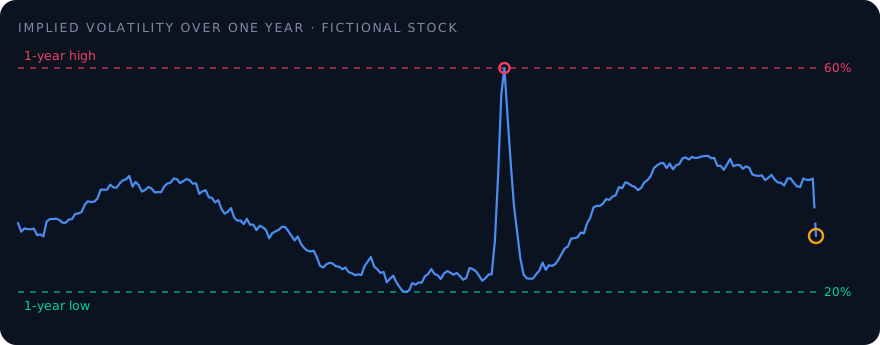
Example: over the past year the IV of a fictional stock moved between 20 % and 60 %. Today it is 30 %. IVR = (30 − 20) ÷ (60 − 20) × 100 = 25. Options are in the lower quarter of their usual price range, even though 30 % may sound high for another stock.
Why buyers care about IV rank
When you buy a call or put, you pay for implied volatility. A low IV rank means you buy volatility cheaply compared with this stock's own history. A high IV rank means the premium already contains a lot of expected movement. If IV falls back to normal, the option loses value even when the stock moves your way; that is the IV crush.
Common mistakes
- Comparing raw IV across stocks. 40 % IV is low for a volatile tech stock and high for a utility. IV rank solves this by comparing each stock only with itself.
- Trusting IVR with a short history. With only a few weeks of data, the range is too narrow and IVR swings wildly. The screener only uses IVR after 10 days and marks it as building before that.
- Ignoring one-off spikes. A single extreme day sets the yearly high for a full year and keeps IVR low afterwards. IV percentile is less sensitive to such spikes.
Frequently asked questions
What is a good IV rank for buying options?
Lower is cheaper. The screener treats an IV rank below 35 as cheap and caps long options at a score of 3 when IV rank is above 50. A low IV rank is not a buy signal on its own; trend and timing still have to fit.
What is the difference between IV rank and IV percentile?
IV rank uses only the yearly high and low. IV percentile counts on how many days of the year IV was lower than today, so a single spike distorts it less.
How often does IV rank change?
Once per trading day. The screener stores one IV value per stock and day on your computer and recalculates IV rank from that history.
See it in the screener
The live demo shows every term with example data, right next to the score and its reasons.